After being moved to Exeter in Summer 2003 the Cray T3Es at the UK met office were finally decomisioned in Summer 2004 being replaced by two NEC SX-6. Seven years of operational service is good going for any super.
Some words and pictures about the internal working of a large Cray T3e.

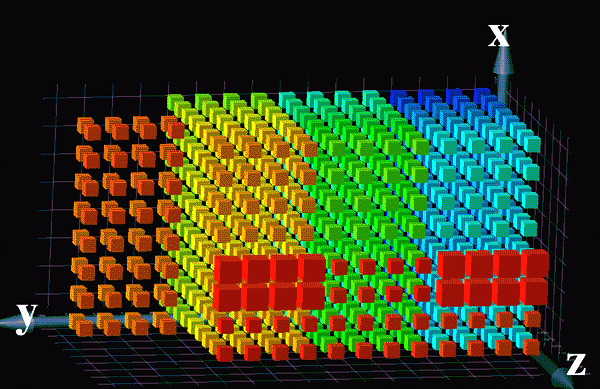
This is a logical representation of SN6702 an 880 CPU Cray T3e/900 installed in the UK. Each coloured cube represents a 450 MHz processing element (PE). In this configuration the PEs are logically positioned in groups of 8 in three dimensions. Each group of 8 is has the shape X=2, Y=4, Z=1. The order within each group of 8 for this system is
7-5-3-1    X
| | | |    |
6-4-2-0 Y--
The colourisation shows the normal logical PE numbering with dark blue at the hidden X=0, Y=0, Z=0 point, moving first up the X axis then along the Z axis until the first group of 4*8*8 is complete. The next group of 4*8*8, coloured light blue to green is placed above on the Y axis. The third group of 4*8*8 PEs, coloured light green to orange comes next completing the base 8*8*12 group. Finally there are two partial plains one consisting of X=8, Y=4, Z=2, coloured orange, the other in the foreground, coloured red in a 4*12*1 configuration.
The relative size of the cubes indicates the size of the memory attached to the processing elements. Most of the PEs have 128 Mb of memory but the 16 larger ones in the foreground have 512 Mb memories.
The processor inter-connection network can be imagined using this picture as the wires that hold the PEs in place. Part of each PE is a Router chip that has 8 connections. 6 of the connections go to the next PE, to and from, in each of the X, Y and Z dimensions. The edge connections loop over to join with the PEs on the far side in each dimension passing through the aligned PEs in the partial plain if required. The two remaining router chip connections go to the CPU part of the processing element and an optional Input/Output gateway. Each of the router connections can be downed to isolate faults within the machine. Data can pass by a PE through the router chip with no cpu intervention. The interconnection network operates at about 320 Mbyte/s with no incremental latency so all the PEs appear, from a timing point of view, to be equally near.


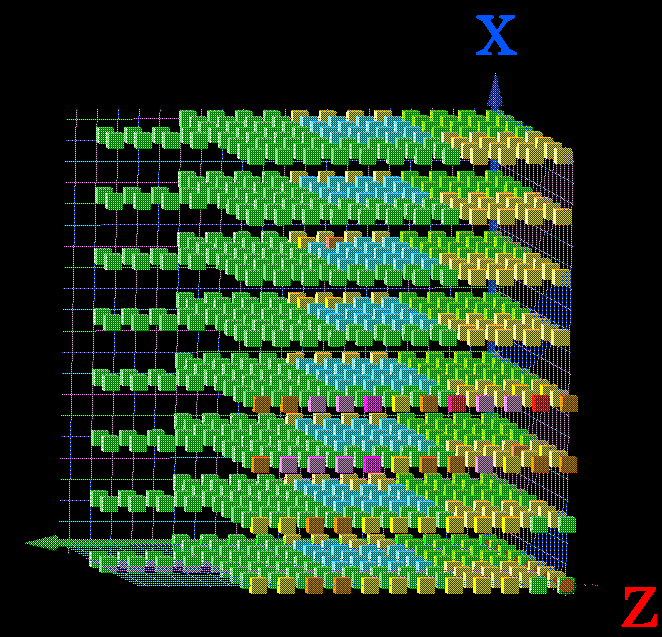
Looking now from a user point of view the machine appears to consist of 17 operating system PEs, 29 command PEs and 834 application processors. The application PEs have been sub divided using labels in this system to perform different types of user work. The colourization in this picture shows the PE type (OS,CMD,APP) and the labels 144Ps each of HADCM3, HCR1, HFC1and - ( none). Some of the high memory PEs have been used as OS pes and the rest reserved for high memory commands. Although the application pool has been subdivided all processors and PE share the same single system image. It does not matter where in the machine an application runs as it sees and has equal access to all operating system services provided by the single system image.
This second picture also shows how cpu faults are handled. The PEs at locations X=5, Y=6, Z=1 and X=1, Y=2, Z=6 are operationally unavailable and are labeled NUL_ . When a PE fault becomes apparent either by a PE panic or a diagnostic indication, it is marked down but remains in its logical position in the torus until the next reboot. At reboot time the logical to physical mapping is adjusted to move the dead PE to the logical top of the machine. One of the hot spare PEs is mapped into the application pool. In this size machine the PEs can only be remaped in groups of 4 so the 3 neighboring PEs X=4,Y=6 & 7,Z=1 and X=5, Y=7, Z=1 are converted to command PEs. In this size machine it is not unusual to have a one or two PEs mapped out and there are hot spares built in to cope with this situation.
This system can deliver more than 64,000,000 seconds of 450 MHz cpu time each day to user applications. Currently it takes about 2.2E6 cpu seconds (over 5 hours real time) to do the global forecasts the rest of the available time is utilised on climate and weather prediction research.
The 13 Input/Output subsystems, connected at various points within the main torus, control the 2 Ethernets, 4 FDDIs and one Hippi network interfaces as well as the 168 DD308 9 Gbyte disk drives in Raid-5 duel controller path configuration. There is also a tape silo with 4 Redwood drives for backups and data migration.
This machine is, as of Nov 1998, the 5th biggest supercomputer in the world according to the bi-annual top 500 list.
Coordinating the efforts of hundreds of cpus is no easy task. The equal peer model used in symmetric multiprocessors starts to fall down when the number of processors involved goes beyond 12 and is nearly impossible beyond 32. The hierarchical service model used in the T3e can scale from 16 to 1600 processors. In this arrangement a proportion of the cpus are dedicated to the operating system (OS), a further group is dedicated to the command and single PE work, the rest are then assigned to one or more application pools. Typically the split would be 1 OS to 3 command to 32 application PEs. The exact ratios would vary from site to site depending on the workload mix. The various tasks of the OS, scheduling, resource control and Input/output processing would be distributed within the OS PEs as separate server processes. The command PEs would run work such as compilations, editing, e-mail and user shells for interactive command processing. The rest of the PE would be assigned to one or more parallel application pools. Multiprocessor tasks would be launched into these application pools with one task per PE on sequentially numbered PEs. The location of the applications within the pool could be changed by hand or automatically by the resource scheduling server in the OS.
| PE category | Approx. Qty in SN6702 |
|
| OS |
|
Kernel work, including IO processing, scheduling resource control, performance statistics gathering, file system and disk management, system call servicing. |
| Command |
|
Shell work, including compilations, editing, e-mail, perl. |
| Application |
|
parallel applications, the real work. |
There are two ways that PE can communicate with each other, firstly by software RemoteProcedureCall ( RPC) and secondly by hardware Barrier / Ureaka BESU trees. The RPC method is used to supported the message passing programing methods and for system call serving. The BESU hardware is used only for synchronization and coordination between application PEs assigned to the same multi PE program and supports the SIMD/MIMD and data parallel programing models.
Processes requiring OS or interprocess communication services would talk using a RPC directly to the PE with the required service. Other messages within the T3e would be data going to and from IOS nodes and returning RPC acknowledgments. All messages would be queued on receipt into one or more message queues.
OS PEs have up to 5 incoming message queues ...
The packet server queues exist only on OS pes that have a packet server and receive incoming messages from the IONs. The RPC queues are used for all the interprocess communication IPC message traffic between the pes. Command and applications PS have just 2 incoming message queues.
Each message that comes into the RPC queue results in an "interrupt thread" being allocated to process the message. The express message queue was created as an attempt to make it a little more fair when high priority processes were competing with lower priority processes for access to OS servers for system call services. A process with a nice value less than 20 would send messages that would otherwise goto the RPC queue to the express message queue. On the receiving side, the message queue interrupt handler, when processing the RPC queue, would check between messages, if anything had come in the express message queue. If so, it would stop processing the RPC queue and service the express queue. The IO done queue and the server-to-server queues were created to overcome resource shortages, specifically memory, not for priority reasons. The idea behind these queues is that we need to process messages from these queues in order to complete work that came in on the RPC or express queue. If we are low on memory, we "stall" the RPC and express queues, but allow messages to be processed from the i/o done and server to server queues. As work completes and memory becomes available again we un-stall the stalled queues.
During a detailed analysis of the system performance of this large T3E a couple of pictures were produced to gain an insight of the inner workings of the T3E operating system Unicos/MK. Unicos/MK is a rare variant of Unix, developed from a Chorus base, specifically to provide a scaleable operating system for massively parallel system such as the T3E.
Just to recap the T3E dedicates its available CPUs into three groups, application, command and operating system. Typically the highest ( logical numbering ) are used as the command and OS CPUs.
In the first of these internal performance pictures we examine one day of Cpu activity across each of the CPUs numbered from Hex300 to Hex36e. At 5 minute intervals the amount of system, user and idle time is sampled on each CPU. In the first picture the size of the sample represents the amount of OS work being done and the colour is set to the amount of user+system work being done.
In the distance are the application CPUs showing as either red ( fully busy ) or missing ( idle ). The command CPUs in the middle range show a pattern of activity that coincides with prime shift (09:00..17:00). The OS Pes ( numbered at the side ) show a pattern of nearly constant activity with peeks of orange and red during prime shift. The OS PE 0x36c was identified as the system bottleneck with 0x360 and 0x365 showing signs of stress with this picture. CPU 0x36c ran all the filesystems, this bottleneck was later reduced by splitting the filesystem handling amongst 3 further CPUs.
In the second picture interprocess communication activity is examined. In this it can be seen that CPU 0x360 is by far the most active CPU with 0x365 a close runner up. CPU 0x360 was responsible for system process management. The 0x360 bottleneck was reduced by changing many of the frequently used shell scripts to work with less external commands. This had the duel benefit of speeding up the scripts and reducing the load on the OS CPU.
ACK = The graphics on this page where produced using the scatterviz feature of Mineset and imgworks. Message queue descriptions provided by J.
Copyright (c) 2000 by "Fred Gannett", all rights reserved. This document may referenced but not copied to any USENET newsgroup, on-line service, web site, or BBS. This document may be distributed as class material on diskette or CD-ROM as long as there is no charge (except to cover materials) and as long as it is included in its entirety and includes this copyright statement.. This document may not be distributed for financial gain except to the author. This document may not be included in commercial collections or compilations without express permission from the author. Downloaded fromGannett 's home page
